
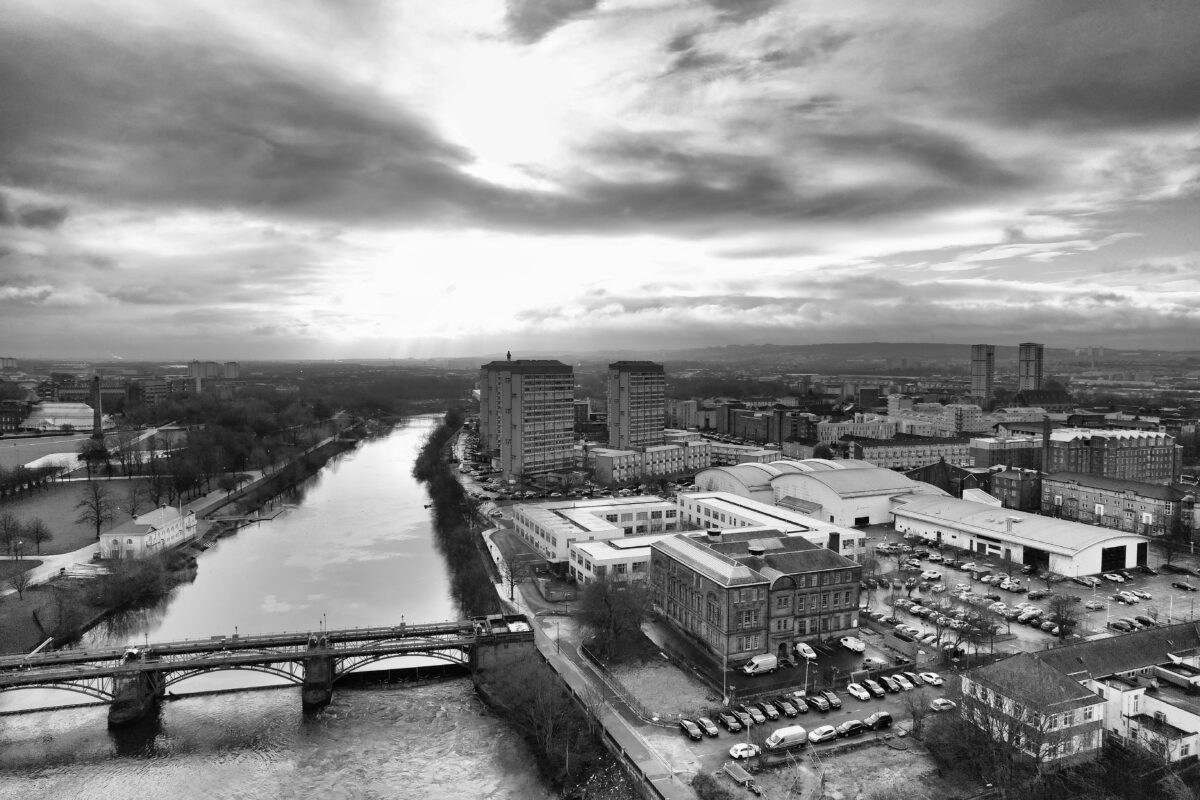
Scotland’s population rose from 5,062,011 in 2001 to 5,439,842 in 2022, an increase of 377,831 people, or 7.5%. The national total disguises a clear geographic split: Edinburgh and much of the east grew strongly, while several west-coast, island and former industrial council areas became smaller.
For a visual companion to Scotland’s Population Since 2001: How Every Council Area Has Changed, the Scotland population and migration explorer is useful for following the longer national story. The figures below use the consistent 2001, 2011 and 2022 census counts for Scotland’s 32 council areas.
This is a long-view comparison, not a snapshot of a single annual estimate. Census dates were 29 April 2001, 27 March 2011 and 20 March 2022, which makes the series a solid way to compare broad change across the same council-area framework.
Scotland’s Population Change by Council Area
East Lothian recorded the fastest percentage growth, rising by 24.6% between 2001 and 2022. Midlothian followed at 19.3%, while Edinburgh added the largest number of residents, nearly 66,000. At the other end, Inverclyde lost 5,777 people, the largest numerical fall.
| Council area | 2001 population | 2022 population | Numerical change | Percentage change |
|---|---|---|---|---|
| Aberdeen City | 212,125 | 224,021 | +11,896 | +5.6% |
| Aberdeenshire | 226,871 | 263,723 | +36,852 | +16.2% |
| Angus | 108,400 | 114,342 | +5,942 | +5.5% |
| Argyll and Bute | 91,306 | 85,970 | -5,336 | -5.8% |
| City of Edinburgh | 448,624 | 514,543 | +65,919 | +14.7% |
| Clackmannanshire | 48,077 | 51,778 | +3,701 | +7.7% |
| Dumfries and Galloway | 147,765 | 145,895 | -1,870 | -1.3% |
| Dundee City | 145,663 | 148,697 | +3,034 | +2.1% |
| East Ayrshire | 120,235 | 120,324 | +89 | +0.1% |
| East Dunbartonshire | 108,243 | 108,937 | +694 | +0.6% |
| East Lothian | 90,088 | 112,284 | +22,196 | +24.6% |
| East Renfrewshire | 89,311 | 96,817 | +7,506 | +8.4% |
| Falkirk | 145,191 | 158,404 | +13,213 | +9.1% |
| Fife | 349,429 | 371,781 | +22,352 | +6.4% |
| Glasgow City | 577,869 | 620,756 | +42,887 | +7.4% |
| Highland | 208,914 | 235,351 | +26,437 | +12.7% |
| Inverclyde | 84,203 | 78,426 | -5,777 | -6.9% |
| Midlothian | 80,941 | 96,527 | +15,586 | +19.3% |
| Moray | 86,940 | 93,293 | +6,353 | +7.3% |
| Na h-Eileanan Siar | 26,502 | 26,140 | -362 | -1.4% |
| North Ayrshire | 135,817 | 133,413 | -2,404 | -1.8% |
| North Lanarkshire | 321,067 | 340,973 | +19,906 | +6.2% |
| Orkney Islands | 19,245 | 21,958 | +2,713 | +14.1% |
| Perth and Kinross | 134,949 | 150,953 | +16,004 | +11.9% |
| Renfrewshire | 172,867 | 183,874 | +11,007 | +6.4% |
| Scottish Borders | 106,764 | 116,821 | +10,057 | +9.4% |
| Shetland Islands | 21,988 | 22,986 | +998 | +4.5% |
| South Ayrshire | 112,097 | 111,519 | -578 | -0.5% |
| South Lanarkshire | 302,216 | 327,056 | +24,840 | +8.2% |
| Stirling | 86,212 | 92,604 | +6,392 | +7.4% |
| West Dunbartonshire | 93,378 | 88,399 | -4,979 | -5.3% |
| West Lothian | 158,714 | 181,278 | +22,564 | +14.2% |
Percentages are calculated from the 2001 and 2022 census counts and rounded to one decimal place. Scotland’s Census provides the underlying census results, while National Records of Scotland is responsible for Scotland’s official population statistics.
The Fastest-Growing Parts of Scotland
The strongest sustained growth was concentrated around Edinburgh and across several eastern and central council areas. East Lothian gained 22,196 residents, a rise from 90,088 to 112,284. It increased in both census intervals, moving from 99,717 in 2011 to 112,284 in 2022 after already growing during the previous decade.
Midlothian shows a similar direction, though its sharpest rise came after 2011. Its population moved from 80,941 in 2001 to 83,187 in 2011, then reached 96,527 in 2022. That is a 19.3% increase across the full period, second only to East Lothian.
Edinburgh’s scale makes its change especially conspicuous. The City of Edinburgh grew from 448,624 people in 2001 to 514,543 in 2022, adding 65,919 residents. Glasgow City also grew throughout the period, climbing from 577,869 to 620,756, even though its pattern and pressures are very different from those of the capital. For a closer look at the city’s neighbourhoods, see where to stay in Glasgow.
Elsewhere, Aberdeenshire added 36,852 people, Highland added 26,437, and South Lanarkshire added 24,840. West Lothian, Fife and Perth and Kinross each added more than 16,000 people. These are not tiny shifts hidden by percentages: they are sustained additions to local populations over two decades. Highland’s growth spans a huge and varied area, including Fort William and the route used by people tackling Ben Nevis for the first time.
Long-Term Decline in Inverclyde, Argyll and Bute and West Dunbartonshire
Several places were smaller in 2022 than they had been in 2001. Inverclyde fell by 6.9%, from 84,203 to 78,426. Its count also fell between 2011 and 2022, continuing a decline already evident in the previous census decade.
Argyll and Bute dropped from 91,306 to 85,970, a loss of 5,336 people. West Dunbartonshire declined by 4,979 people, from 93,378 to 88,399. The Outer Hebrides, officially Na h-Eileanan Siar, also finished below its 2001 count, falling by 362 residents.
North Ayrshire and Dumfries and Galloway had more modest long-term falls, while South Ayrshire was nearly flat but still lower in 2022 than in 2001. A percentage can make smaller areas look dramatic, so it is always worth reading the headcount alongside it. Inverclyde’s 6.9% fall represents fewer people than Edinburgh added in a single two-decade comparison, but it is a major change for a council area of under 80,000 residents in 2022.
Places Where Growth Slowed or Reversed After 2011
The 2001-to-2022 line can conceal a change of direction. Angus, for example, rose from 108,400 in 2001 to 115,978 in 2011, then slipped to 114,342 in 2022. It remains above its 2001 population, but the second period was a reversal.
Dumfries and Galloway, North Ayrshire, South Ayrshire, Shetland Islands and Na h-Eileanan Siar also had lower 2022 counts than 2011 counts. Moray was almost unchanged in the latter interval, edging from 93,295 in 2011 to 93,293 in 2022. This is why a full census series is more useful than calling an area simply “growing” or “shrinking.”
Glasgow City ran in the other direction. Its population increased from 593,245 in 2011 to 620,756 in 2022, following growth in the previous decade. Scotland’s Census reported that Glasgow’s population rose 4.6% between 2011 and 2022, while its household count rose 2.8%.
How To Read Scotland’s Population Figures
These numbers are census counts, not annual mid-year estimates. Census results are especially helpful for a 2001-to-2022 comparison because they provide fixed reference dates and avoid mixing annual estimates produced under different assumptions.
Population statistics can be revised when new evidence or improved methods become available, particularly in annual estimate series. Council boundaries can also complicate long historical comparisons if a dataset uses different geographic definitions. For this table, the three census points are presented by the same 32 modern council areas, making the comparison cleaner than trying to stitch together smaller local geographies.
Population change is shaped by births, deaths and migration. The Scottish Government’s population history work describes Scotland’s return to growth after 2000 as being driven chiefly by a shift from net outward migration to sustained net inward migration, rather than by births exceeding deaths. That national trend does not land evenly in every town, island or council area. Scotland has never been especially keen on making maps simple.
Frequently Asked Questions
Which Scottish council area grew the most since 2001?
The City of Edinburgh added the most people, increasing by 65,919 between the 2001 and 2022 censuses. East Lothian had the largest percentage rise, at 24.6%.
Which Scottish council area lost the most population since 2001?
Inverclyde recorded the largest numerical and percentage decline in this comparison, losing 5,777 residents, or 6.9%, between 2001 and 2022.
Did Glasgow’s population increase after 2001?
Yes. Glasgow City’s census population rose from 577,869 in 2001 to 620,756 in 2022, an increase of 42,887 people.
Why does the table end in 2022 rather than 2025?
The 2022 census is the latest consistent census point in this comparison. Annual population estimates can provide later dates, but they are a different statistical series and should not be casually substituted for census counts.
Related Reading Ideas
- Scotland Population and Migration: What Drives Change Across the Country
- Edinburgh, Glasgow and Aberdeen: How Scotland’s Major Cities Have Changed
- Depopulation in Rural Scotland and the Islands: Areas to Watch
- Scotland Census Results Explained: Population, Households and Migration