
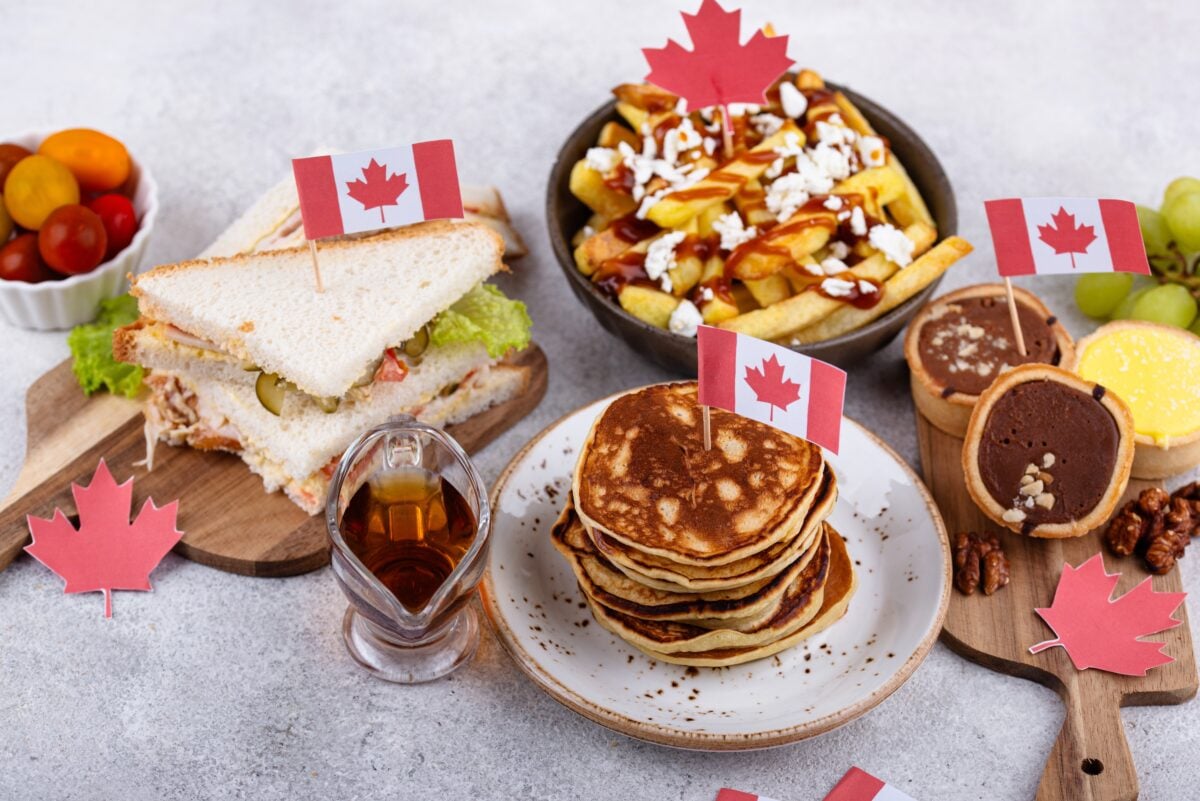
Canadians spent $9.44 billion at restaurants, cafés, takeout counters, catering businesses and drinking places in May 2026, according to newly released official Statistics Canada data.
Ontario recorded the largest total at $3.71 billion, followed by Quebec at $1.85 billion, British Columbia at $1.62 billion and Alberta at $1.21 billion.
The figures below are unadjusted receipts, meaning they include normal seasonal effects such as warmer weather, increased tourism, patios reopening and other month-to-month changes in consumer activity.
Use the interactive map to see where each province and territory ranks, how much restaurant spending increased from April and how large each region’s share of the Canadian total was.
Use the map and rankings below to explore the figures, compare two provinces and see how Canada’s monthly restaurant spending breaks down by day, hour, minute and second. The official figures come from Statistics Canada’s Monthly Survey of Food Services and Drinking Places, Table 21-10-0019-01 .
Official Statistics Canada data explorer
Canada Restaurant Spending Map
Explore unadjusted restaurant, food-service and drinking-place receipts across Canada during May 2026. Select a region to view its official monthly sales, national rank and change from April.
Important: These figures are unadjusted. Monthly changes include normal seasonal effects such as warmer weather, tourism and increased patio activity.
Explore the Map
Select a province or territory to view its official May 2026 receipts.
Click or tap a region on the map
Province and Territory Rankings
Rank regions by total May receipts or by their increase from April.
Compare Provinces and Territories
Choose two regions to compare their official May 2026 receipts.
Ontario
$3.712 billion
Alberta
$1.206 billion
Canada’s Restaurant Receipts by Time
Canada’s May total expressed as an average by day, hour, minute and second.
Source: Statistics Canada Table 21-10-0019-01 . Total food services and drinking places, receipts, unadjusted. Figures in the source table are expressed in thousands of Canadian dollars. Reference period: May 2026.
What the Statistics Canada Restaurant Data Shows
Statistics Canada reported $9.44 billion in unadjusted food-service and drinking-place receipts across Canada in May 2026. That was an increase of approximately 12.0% from the $8.43 billion recorded in April.
Every province and territory included in the dataset reported higher receipts in May than in April. Yukon recorded the fastest percentage increase at approximately 15.3%, followed by Prince Edward Island at 14.2% and Quebec at 13.4%.
Ontario Accounted for Nearly Two-Fifths of the Total
Ontario remained by far the largest restaurant market in Canada, with $3.71 billion in receipts during May. That represented approximately 39.3% of the national total.
Quebec accounted for about 19.6% of the Canadian total, while British Columbia represented approximately 17.2% and Alberta accounted for around 12.8%.
Higher Totals Do Not Necessarily Mean Residents Ate Out More Often
A province with a larger total does not automatically have residents who eat out more frequently. Population size, tourism, restaurant prices, major events and the number of food-service businesses can all affect the amount recorded.
Ontario, Quebec, British Columbia and Alberta naturally dominate the national rankings because they have the largest populations and some of Canada’s biggest urban and tourism markets.
Why the May Increase Should Be Read Carefully
These figures are unadjusted, so the monthly increase should not be interpreted as a pure measure of economic growth. Unadjusted data includes predictable seasonal patterns, including warmer weather, longer daylight hours, increased travel and the return of outdoor dining.
This means the 12.0% national increase from April to May reflects a combination of seasonal activity, changes in customer demand, menu prices and the number or value of transactions.
Receipts Are Not the Same as Restaurant Profits
The figures represent the money received by businesses before expenses. They do not show how much profit restaurants kept after paying for food, wages, rent, utilities, insurance and other operating costs.
Restaurant receipts can rise at the same time that businesses face pressure from higher operating costs.
How Much Was Spent Each Day?
Based on the May total, Canadians spent an average of approximately $304.4 million per day at food-service and drinking establishments. That works out to about $12.68 million per hour, $211,395 per minute and $3,523 per second.
About the Official Dataset
The figures come from Statistics Canada Table 21-10-0019-01, covering total food services and drinking places under the North American Industry Classification System. The selected service detail is receipts, and the seasonal adjustment setting is unadjusted.
Statistics Canada publishes the source values in thousands of Canadian dollars. The interactive tool converts them into millions and billions to make the figures easier to read.
The source table marks almost all May figures with an A data-quality rating, meaning excellent. Statistics Canada may revise monthly data as more complete information becomes available.
View the full official dataset in Statistics Canada Table 21-10-0019-01 .